How to Make the Most of Momentum Screener
Use the guides on this page to learn how to use the Momentum Screener tools: review the features of the stock table, or learn to manage your favorites.
How to Use the Stock Table
Still have questions? Please reach out to us.
Main Graph
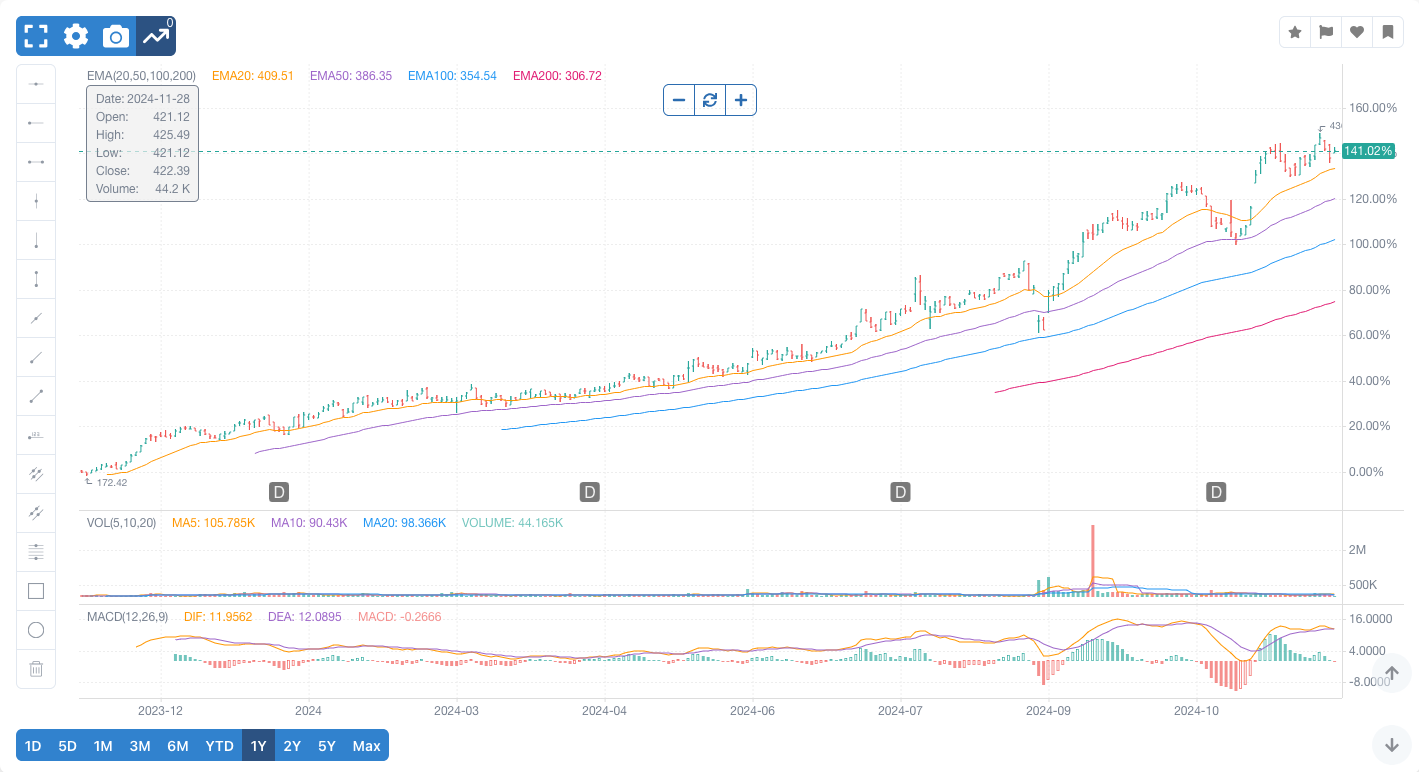
Graph Key
The information in the gray box displays daily data based on where your cursor is located on the graph, updating as the mouse is moved. The box will appear in either the upper left or upper right corner based on your cursor location.
Date
Where the vertical crosshair is located
Open
Opening price
High
High price
Low
Low price
Close
Closing price (including the most recent intra-day price for current day *advanced subscription only*)
Volume
Volume of trading
Above the information box will be values for any enabled main-graph indicators.
Below the graph is a row of quick-select buttons to display the indicated time periods.
- Shorter time periods will expand to fill your graph display. Drag your graph from left to right to see older dates. Longer time periods may not fully display in your graph and may require dragging the graph from left to right to view older dates.
- Longer time periods may require a few moments to load the requested data. You may need to refresh your browser to display the data after it loads.
- The Max time period will display back to the beginning of the security or 2000-01-03 for most securities. Some securities will include data preceding this date, if available.
The graph is interactive — use your mouse or keyboard. Click the arrow buttons on the bottom-right corner of the graph to view the next or previous Stock Chart.
Keyboard Shortcuts
| Key Binding | Function |
|---|---|
| shift + → | shift right |
| shift + ← | shift left |
| shift + + | zoom in |
| shift + - | zoom out |
| n | next Stock Chart |
| b | previous Stock Chart |
Graph Markers
To the left of the graph, a variety of temporary graph markers are available to assist your review. Click on the marker to select. Click on the graph to set the marker starting point. Continue to click to set any remaining marker points. Right click on a marker to remove that marker. Click on the trash can at the bottom of the list to remove all markers on the graph.
Graph Settings
All of the graph settings will be preserved in your browser memory. You will need to set them up separately on each browser and device you use. Open Graph Settings by clicking on the gear icon at the top left corner of the Main Graph.
General

Y-Axis Percentages
Enable to display the change in stock price as a percentage based on the left-most visible value in the window. Disable to display the price. Default: Enabled
Adjusted Prices
Enable/disable the display of historical stock prices adjusted for splits and dividends. Default: Enabled
Graph Panning
Enable to change the date range of the graph display using touch-and-drag. Disable to move the crosshair cursor without changing the graph display. Default: Enabled
Line Type
Select one of the following line types. Default: OHLC
- OHLC (Open, High, Low, Close)
- Solid Candle
- Hollow Candle
- Hollow Up
- Hollow Down
- Area
Indicators
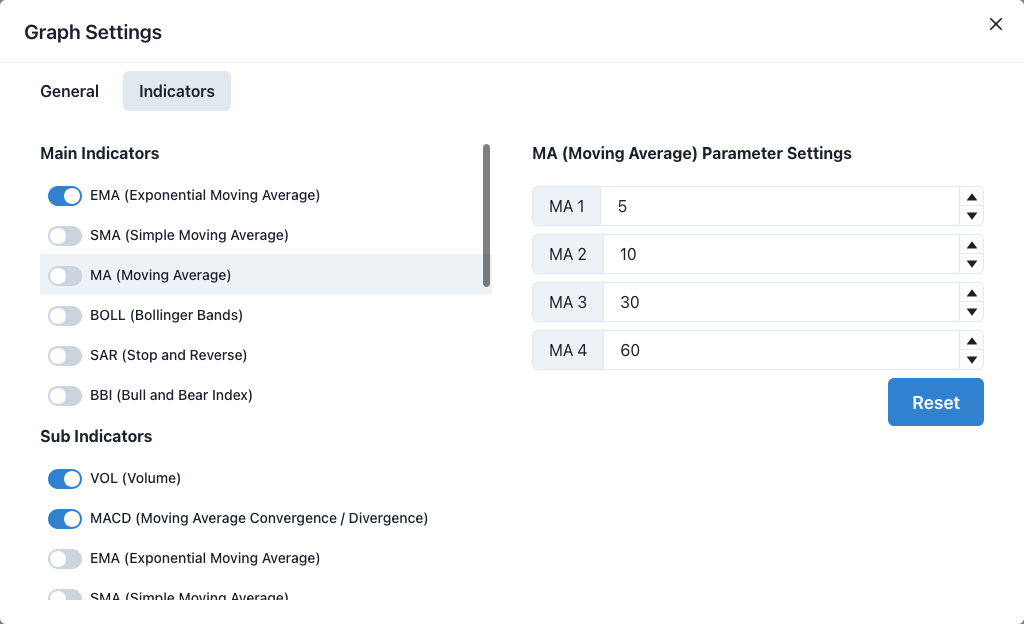
Each indicator can be toggled at the left side of the window. Clicking the row for an indicator on the left side presents a list of configurable parameters for the indicator on the right side, with defaults provided. You can change these as desired or use the reset button to set them back to the default values. The main EMA indicator and the sub VOL and MACD indicators are all enabled by default.
Main Indicators
These indicators layer on top of the main stock graph. The following indicators are available:
- EMA (Exponential Moving Average)
- SMA (Simple Moving Average)
- MA (Moving Average)
- BOLL (Bollinger Bands)
- SAR (Stop and Reverse)
- BBI (Bull and Bear Index)
Sub Indicators
These indicators appear as their own graph below the main stock graph. The following indicators are available:
- VOL (Volume)
- MACD (Moving Average Convergence / Divergence)
- EMA (Exponential Moving Average)
- SMA (Simple Moving Average)
- MA (Moving Average)
- BOLL (Bollinger Bands)
- SAR (Stop and Reverse)
- BBI (Bull And Bear Index)
- KDJ (KDJ Index)
- RSI (Relative Strength Index)
- BIAS (Bias Ratio)
- BRAR (Sentiment)
- CCI (Commodity Channel Index)
- DMI (Directional Movement Index)
- CR (Energy)
- PSY (Psychological Line)
- DMA (Different of Moving Average)
- TRIX (Triple Exponentially Smoothed Moving Average)
- OBV (On Balance Volume)
- VR (Volatility Volume Ratio)
- WR (Williams %R)
- MTM (Momentum Index)
- ROC (Price Rate of Change)
- PVT (Price and Volume Trend)
- AO (Awesome Oscillator)
Fundamentals

The Fundamentals Table appears below the graph area and displays specific information about the selected stock. Located in the upper right of the table, the Google and Yahoo buttons will load the selected stock's profile on each respective site in a new tab.
Table Items
| Last Closing Price | The price as of the most recent close of the market. |
| Change | The percent difference between the two most recent closing prices. |
| 52W High/Low | The high and low closing prices over approximately the last 52 weeks. |
| Dividend | The forward annual dividend percentage based on the most recent closing price. |
| Market Cap | The market value of a company, calculated using the current price of one share multiplied by the outstanding number of company shares (also known as Market Capitalization). |
| P/E | The Price-to-Earnings ratio is calculated as the price divided by the earnings per share, using data from the previous year. |
| EPS | The Earnings Per Share is calculated as the company’s (net) profit divided by the number of outstanding shares (the standard EPS calculation). |
Drawdown (DD) Values
Toggle any of the drawdown values in the table to display the range on the graph where the drawdown occurred in the given time period.
Drawdown is a period of high-to-low decline by percent during a specific period. In the Fundamentals section, you will see the percent-change for the following time periods. Toggle each row to see corresponding arrows on the graph for the indicated drawdown range. Note that some time periods share the same drawdown period, so the arrows might overlap and not be visible when you have more than one time period selected.
| 12-0 DD | Largest drawdown in the 12 months before today. |
| 9-0 DD | Largest drawdown in the 9 months before today. |
| 6-0 DD | Largest drawdown in the 6 months before today. |
| 3-0 DD | Largest drawdown in the 3 months before today. |
| 1-0 DD | Largest drawdown in the 1 month before today. |
| 12-9 DD | Largest drawdown in the range between 9 and 12 months before today. |
| 9-6 DD | Largest drawdown in the range between 6 and 9 months before today. |
| 6-3 DD | Largest drawdown in the range between 3 and 6 months before today. |
| 3-1 DD | Largest drawdown in the range between 1 and 3 months before today. |
| 1-0 DD | Largest drawdown in the 1 month before today. |
For more information regarding drawdowns, we suggest starting your study with Investopedia. (Momentum Screener is not affiliated with Investopedia)
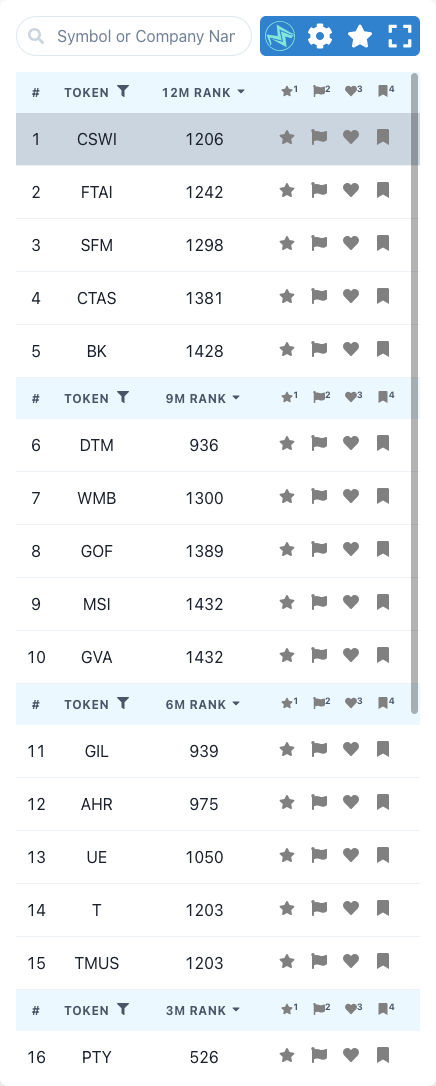

Ticker Table
The Ticker Table to the left of the graph reflects sort order within the algorithm according to the most recent closing price. The table is re-sorted based on processing of current-day closing data starting at 5:00 p.m. ET (New York) as data is received. Current-day data is displayed on the graph and pulled each time the graph is refreshed, but won't be reflected in the table until the close-of-day data is processed.
Rank (i.e. 12M RANK, 9M RANK, etc.) is a global rank across the entire market (approximately 50,000 total symbols). Your chosen Table Settings define the subset of the market that will be visible.
If a symbol fits in the top X ranking (where X is the “Count per group” you have defined in your Table Settings), for more than one group, it will be displayed in the top displayed group. If a top group is removed, the symbols will be re-ranked according to the currently displayed groups.
Search and Code Filter
To search for a specific stock to add to the Ticker Table, select the search box. Type into the search box—you can search by symbol or company name. You can display the fundamentals and graph of the result you want to view by clicking on that line in the list. The search box will return results from the following US exchanges:
- NYSE
- NASDAQ
- NYSE ARCA
- OTC/PINK
If you have filtered your table to display only items contained within a Favorites List and you start a search, your filters will be cleared.
Once you have displayed the result, you can then use the Code Filter within the table to view that item's rank within the table by typing either the symbol or company name. Code Filtering only works on items currently displayed within the table.
Favorites Lists
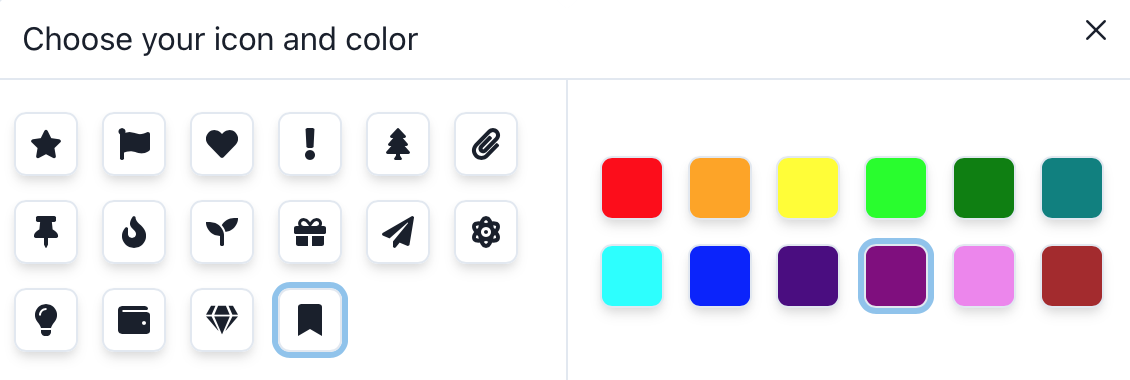
There are up to sixteen customizable icons and twelve colors available in your Account Settings (depending on subscription level) to save and organize the symbols you want to quickly filter and review.
Lists may be organized in any way that assists the user's review purposes and can be edited on the Stock Table page or in your Account Settings. For example, one list might be currently-owned stocks and the second list could be stocks to be watched, while the third list could be the stocks held in a spouse's 401k mutual fund. Another example is for each list to display a portfolio, so the first list displays the user's holdings at Fidelity, the second list displays holdings at E*Trade, etc.
Symbols can be added or removed from a Favorites list by toggling the respective icon on that row in the table or in the upper right corner of the graph. If you prefer keyboard shortcuts, each icon also has a number key assigned, corresponding to the order it shows in the table. For example, pressing 1 will toggle the first favorite, 2 the second, and so on through 0 for the tenth. If you have more than ten favorites enabled, pressing shift + 1 will toggle 11, shift + 2 will toggle 12, and so on through 16. The Table can be filtered to display only select favorites by toggling the icon on the top row in the Ticker Table.
Symbols that are included in a Favorites list will always be included in the table. If you want a search result to remain in your table list after you refresh the page, it must be added to a Favorites list.
List contents can also be edited in their respective box in Account Settings. Premium level subscribers can add additional lists and customize their favorite icons. See the Account Settings How To tab for additional information on how to manage lists and list options.
Navigation
To “walk” from symbol to symbol, use n for next and b for back. Another option is to use the up and down arrows located in the bottom-right corner of the graph area. For mobile, the up and down arrows are the easiest option. Note that you cannot use the arrow keys on your keyboard to navigate between stock charts.
Ticker Table Settings
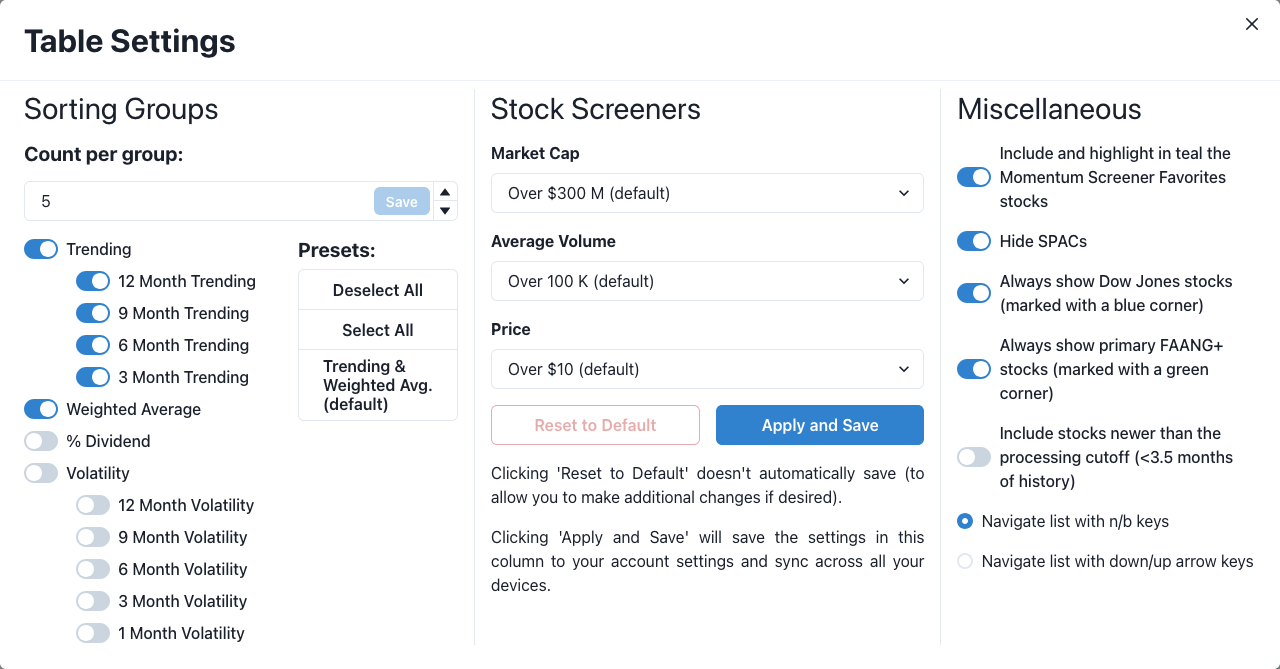
The table settings allow the user to control which stocks are displayed in the table. Except where noted below, these settings are specific to your local browser.
Sorting Groups
The Sorting Groups section controls which categories of stocks are displayed in the table.
| Trending | Period of time over which a stock is analyzed for momentum. |
| Weighted Average | Average growth month to month, with more weight given to more recent months. |
| % Dividend | The annual percent dividend sorted highest to lowest. |
| Volatility | Measures price drops relative to the average price over the specified period of time. |
| Presets | Easily add or remove multiple groups with one click. |
Stock Screeners
The Stock Screeners section contains categories to control which stocks from the available markets are displayed based on company indicators. Available screener options are based on the user's subscription level. These settings sync with your user profile between devices and browsers.
| Market Cap | The most recently published value of the company. |
| Average Volume | The average trade volume over the last year. |
| Price | The most recent closing price. |
| Reset to Default | Resets the Stock Screeners settings to default. Clicking ‘Reset to Default’ doesn't automatically save (to allow you to make additional changes if desired). Click ‘Apply and Save’ if you want to view the table with default settings. |
| Apply and Save | Saves the selected Stock Screeners settings to your account, syncs across all your devices, and loads a fresh table. |
Miscellaneous
The Miscellaneous section controls general table settings.
| Momentum Screener Favorites | Include and highlight in teal the Momentum Screener Favorites stocks. Updated periodically. |
| Hide SPACs | Enabling this setting will hide SPACs and companies categorized as shell companies. |
| Include Dow Jones | When the Dow Jones stocks are included in the table list, they are marked by a small blue triangle at the upper right corner of the row. |
| Include newer than cutoff (<3.5 months of history) | Enabling this setting will include all IPO stocks with less than 3.5 months of history. IPO stocks are not included by default because sufficient time has not passed to perform data analysis. If enabled, the displayed data will be incomplete due to lack of historical data. |
| Navigate list with n/b keys | Selecting this option allows navigation of the Ticker Table using n for next and b for back. |
| Navigate list with down/up arrow keys | Selecting this option allows navigation of the Ticker Table using the ↓ and ↑ arrow keys. |
How to Manage Your Favorites in Account Settings
By clicking on your email in the upper right corner of the page, you can access your account settings by choosing Account from the drop-down menu. To manage your favorites, click on Stock Favorites from the tabs.
Subscribers to the Essentials level can choose up to five personalized Favorites and Advanced subscribers can choose up to fifteen personalized Favorites. Click and drag the icon to change the order of your lists. Click on the icon to change the icon or color. Click on the pencil next to the name of the Favorites list to edit the name.

“Hide list” will remove this Favorites icon from display in your table. It will not remove any symbols that would otherwise be displayed. You will not lose the contents of this list.
Clicking on the Trash Can icon will remove your Favorites list. If your list is not empty, you will receive a confirmation prompt, as deleting the Favorites list cannot be reversed.
If the Save icon is light green, no action is needed. If the Save icon is dark green, you must click Save to retain and apply your changes.
Symbols for stocks, bonds, and mutual funds can be entered on the Stock Favorites tab. Symbols are divided by commas and individual symbols can be included on multiple lists. See the Favorites Lists section for ideas of what symbols you may want to include first.
Disclaimer
This site is intended for general information purposes only. There is no intent to provide specific advice or recommendations. See our full legal disclaimer here.
Momentum Screener does not save any of your financial data. Your credit card will be processed through Paddle, our secure third-party payment processor.
© 2020-2022 Copyright Momentum Screener LLC